 | 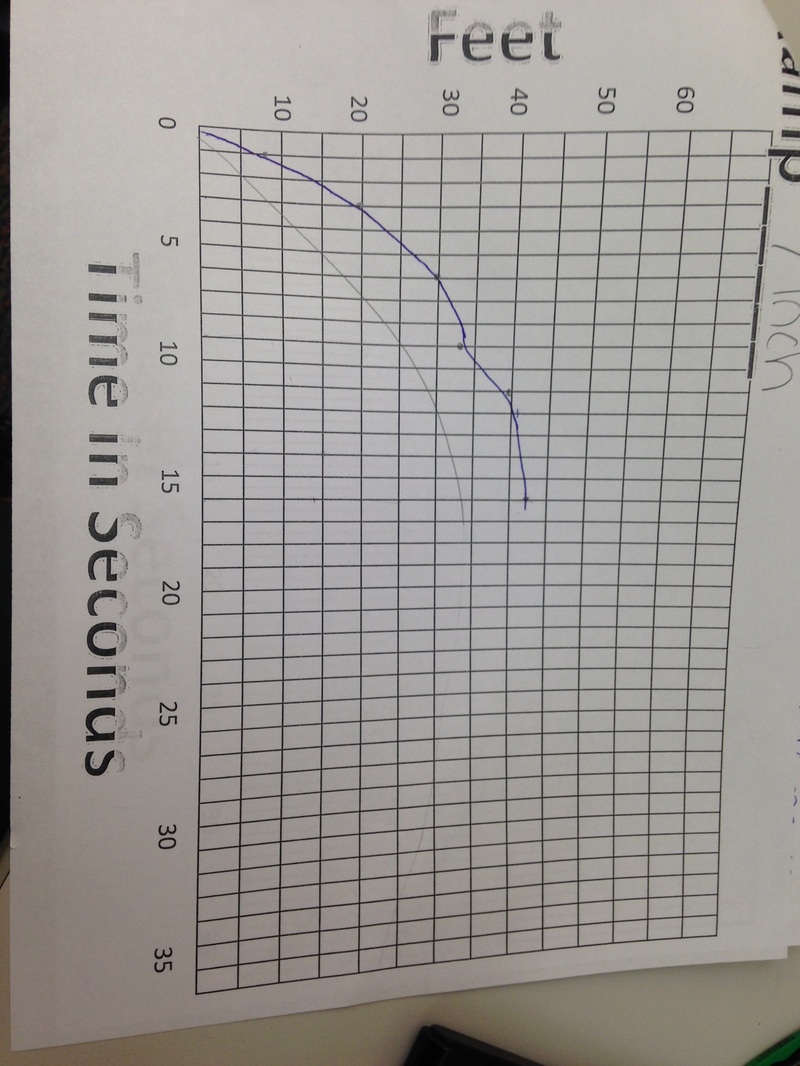 |
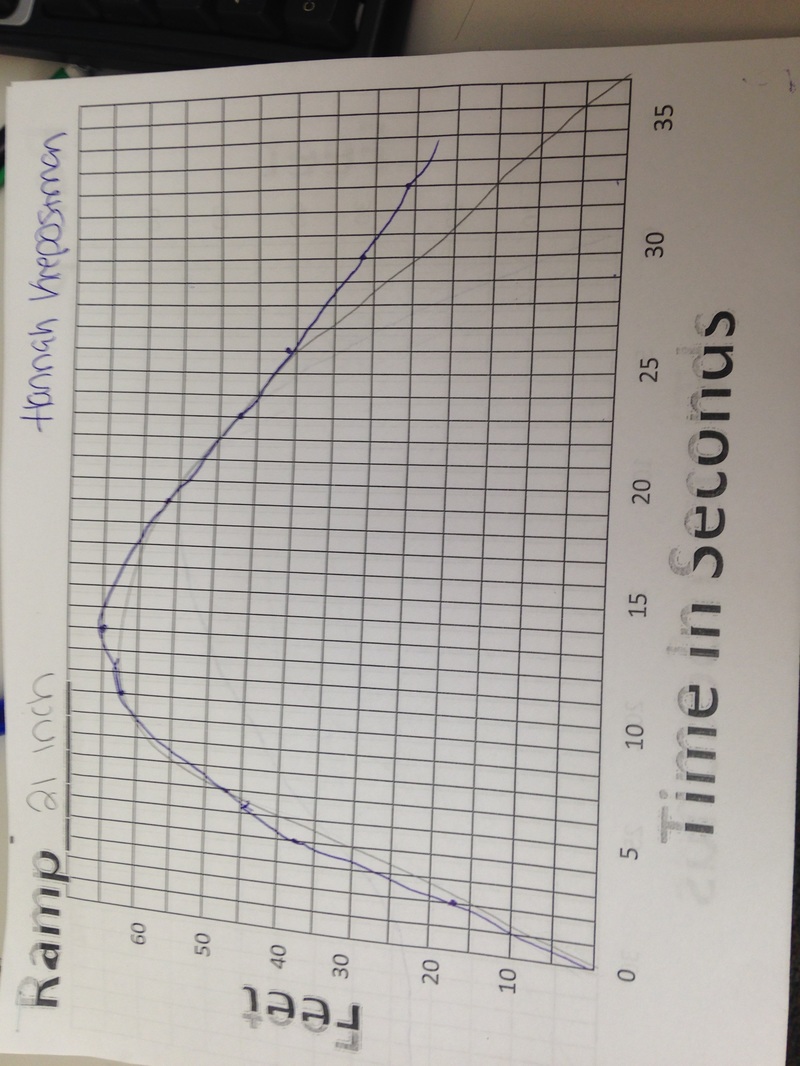
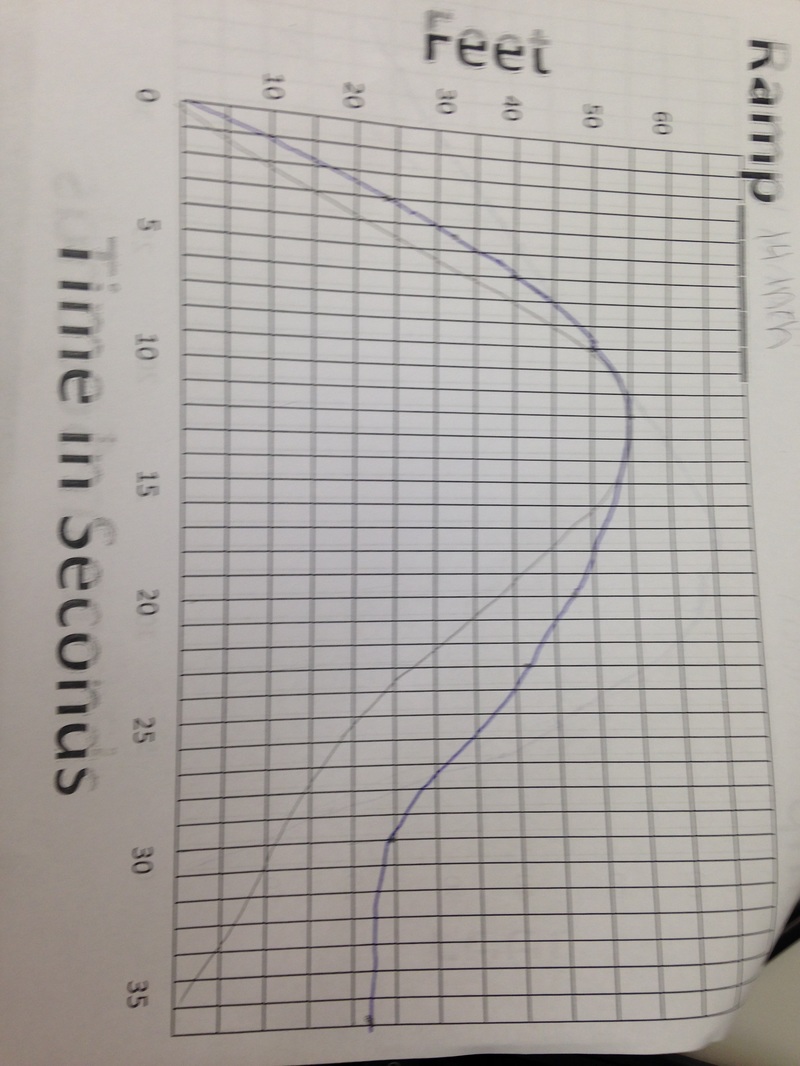
My original graphs were not too far off from the actual graphs. When I watched the video I got a good visual understanding of what the graph may turn out to look like. When the skateboard would start, represented by the zero, it would then be able to move faster and get more distance. The first two graphs were quite similar, with a the maximum being rather high and then going down at a gradual speed. However, the last graph stopped abruptly. I found that the distance increases the most when the skateboard first takes off and then when the skateboard loses its momentum, the skateboard begins to slowly stop.
 RSS Feed
